Daily New COVID-19 Cases
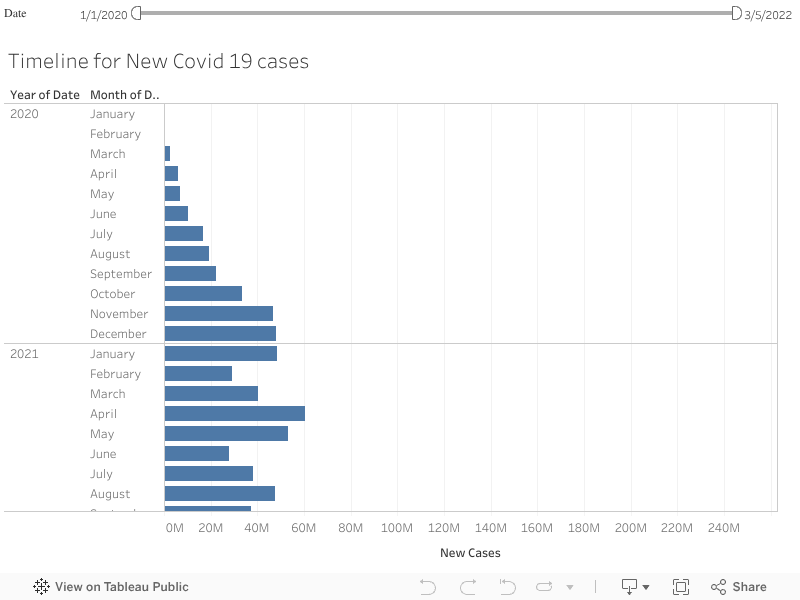
The above graph is a horizontal bar graph with date, month and year on y-axis and number of new cases in x-axis. We can see that the timeline is from January 2020 to March 2022 and can be expanded into days if needed. For comparison in months, we are considering the timeline to be divided into months and the highest number of new cases can be observed in January 2022.By hovering over the graph, we can get the exact number of cases for example, in January 2022, total number of new cases are 250,135,770.