Timeline of COVID-19 Deaths
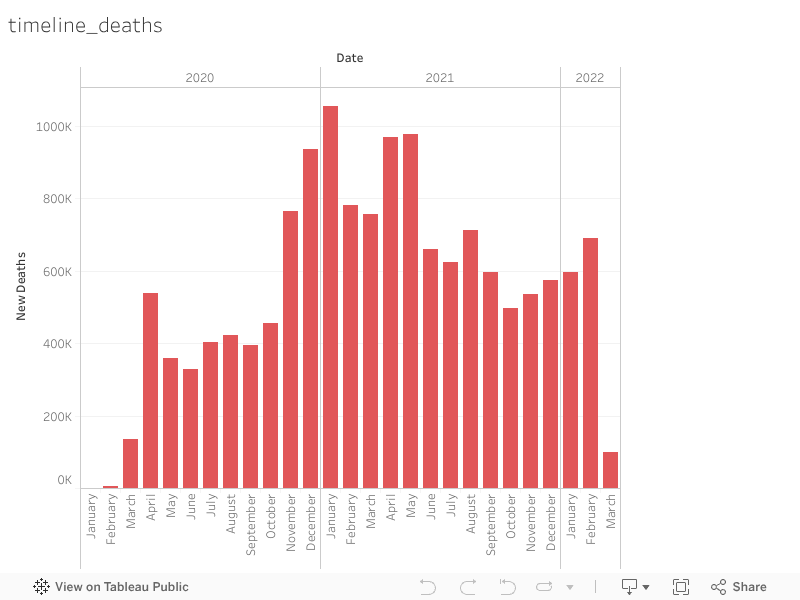
This interactive visualization shows the daily reported deaths due to COVID-19. It provides a detailed view of the timeline, highlighting the severity and impact of the pandemic over time.The visualization is a bar chart representing the total number of deaths for each month. This can be expanded to days. We can see that the highest number of deaths are observed in January 2021 with a number of 1,054,587 and the lowest in January 2020. We can observe the spike in the covid deaths during November 2020.